

In cybersecurity, a honeypot isn’t a jar of honey – it’s a decoy system designed to lure in attackers. It mimics a vulnerable server or service, appearing as a juicy target (like an open SSH or database) while actually being isolated and closely monitored. Any interaction with a honeypot is inherently suspicious, since no legitimate user should normally touch it. By setting up this trap, organizations can capture malicious activity (malware, exploits, login attempts, etc.) and learn how attackers operate.
- Decoy & Detection: Honeypots behave like real assets (with fake vulnerabilities), so attackers reveal themselves when they probe or breach them.
- Threat Intelligence: Every attack on the honeypot is logged. Analysts can study this data to understand attacker tactics, techniques and procedures (TTPs), malware samples, and new exploits.
- Isolation: Because a honeypot is isolated, even if compromised it cannot harm production systems. It safely “wastes” the attacker’s time without impacting real assets.
Why Honeypots Matter Today
Modern networks face stealthy, sophisticated threats (zero-day exploits, automated botnets, advanced persistent threats, etc.). Honeypots add a proactive layer of defense by acting as early-warning sensors. Since no legitimate traffic should hit a honeypot, any interaction signals a potential breach. Large enterprises and security teams use honeypots to actively detect and analyze attacks, especially against advanced persistent threat (APT) actors. Instead of only building higher walls, honeypots deceive attackers – diverting them into traps and buying time for defenders. In practice, they:
- Catch Hidden Attacks: Reveal threats that might slip past traditional security (IDS/IPS, firewalls).
- Provide Early Warning: Alert defenders to in-progress attacks or unusual scanning activity.
- Boost Threat Intel: Gather malware samples and attack patterns to improve overall security posture.
- Hone Defensive Skills: Serve as safe testbeds for security teams to monitor real hacker behavior and tune detection rules.
Meet T-Pot: The All-In-One Honeypot Platform
Imagine bundling dozens of honeypots into one ready-to-run system – that’s T-Pot. Developed by Deutsche Telekom’s security team, T-Pot is an all-in-one, multi-honeypot platform that simplifies running a professional honeypot farm. In one Docker-powered deployment it spins up 20+ different honeypot daemons (SSH, web, IoT, industrial control, and more) simultaneously. Under the hood it uses the Elastic (ELK) stack to aggregate and visualize all logs, and even features animated attack maps. T-Pot’s containerized design makes it relatively low-maintenance, and it can optionally share (opt-in) anonymized data with a community dashboard (Sicherheitstacho) for collective threat intelligence.
Key Features of T-Pot:
- Multi-Honeypot Suite: Runs 20+ pre-configured honeypots (e.g. Cowrie SSH, Dionaea malware catcher, Glastopf web honeypot, etc.) out of the box.
- Containerized & Scalable: Each honeypot is isolated in Docker, so you can deploy the whole suite on one server (or spread across sensors) with minimal conflicts.
- Centralized Logging: Built-in Elastic Stack (Elasticsearch, Logstash, Kibana) collects all attack data into unified dashboards.
- Real-Time Visualization: Live attack maps and Kibana charts let you watch hacking attempts in real time.
- Community Data Sharing: Optionally feeds into Telekom’s security dashboard for broader threat analytics.
Honeypot vs Multi-Honeypot Platforms
| Feature | Traditional Honeypot | T-Pot (Multi-Honeypot) |
|---|---|---|
| Deployment | Single decoy server/service | Automated, containerized (Docker) |
| Scope/Coverage | One system or service | Entire network range with 20+ honeypots |
| Data Collection | Basic logs on one trap | Centralized ELK logging and analysis |
| Maintenance | Manual per honeypot (can be time-consuming) | Low effort (auto restarts, updates via Docker) |
| Threat Visibility | Limited to one attack vector | Broad: multiple services, multiple attack vectors |
| Community Sharing | Usually isolated/standalone | Opt-in community intelligence (Sicherheitstacho) |
This comparison highlights how a single honeypot (a solitary trap) offers limited visibility, whereas T-Pot’s multi-honeypot approach turns a one-off decoy into a full-fledged honeynet. By covering many protocols and services at once, T-Pot sees a wider range of attacks and provides richer data to defend your network.
With T-Pot in place, even small teams can deploy a professional honeypot system that captures attacker behavior at scale. In essence, T-Pot blends active deception with threat detection – a powerful combination in today’s cybersecurity landscape.
Understanding T-Pot
T-Pot (short for Threat Intelligence Pot) is an all-in-one honeypot platform developed by Deutsche Telekom’s security team. Think of it as a ready-made honeypot laboratory: T-Pot spins up 20+ different decoy services (SSH, web, IoT, industrial control, mail, and more) all at once, automatically creating an environment that’s attractive to attackers. In the world of cybersecurity deception tools, T-Pot stands out by bundling dozens of traps under one roof. Each honeypot service runs in its own Docker container, funnels its logs into a central Elastic Stack (ELK) setup, and feeds data to nice dashboards (Kibana) and live attack maps. In short, T-Pot automates deployment and analysis, so you can focus on threat intelligence instead of wrangling servers.
T-Pot’s multi-container architecture ties dozens of honeypots and tools together. Each trap (for example, Cowrie for SSH/Telnet or Dionaea for capturing malware) runs in Docker, while Suricata’s network IDS watches all traffic. All events and alerts flow into a unified ELK stack and visualization layer. You can run it on a single “Hive” host or scale out with extra “Sensor” nodes: sensors run the honeypots and forward logs to the Hive for central analysis. This means T-Pot is flexible – it works on Linux (Ubuntu), and even macOS/Windows via Docker Desktop – and it makes setting up production-grade honeypots surprisingly easy.
Key T-Pot Components & Features
- Containerized Honeypot Suite: T-Pot provides pre-built Docker images for all its honeypot services. Out of the box you get a mix of popular traps: e.g. Cowrie (SSH/Telnet), Dionaea (malware-capturing), Mailoney (SMTP), Glastopf (web), Conpot (industrial control/SCADA), CiscoASA emulator, IPP printer honeypot, WordPot (fake WordPress), and dozens more. This multi-protocol approach means a single T-Pot server attracts attacks on many fronts at once.
- Docker & Docker Compose: T-Pot heavily leverages Docker for ease of deployment. You simply run the installer and it pulls dozens of containers automatically. This guarantees each honeypot is isolated, easy to update, and auto-restarted on failure. The official docs even include an Autoheal tool to reboot any failed container. In short, T-Pot does the heavy lifting – no tedious manual installs of each honeypot service.
- Elastic Stack (ELK) Integration: All honeypot logs are centrally ingested into Elasticsearch/Logstash and presented in Kibana dashboards. T-Pot comes with pre-configured Kibana views (login attempts, top attackers, event timelines) and live attack maps showing source IP geolocations. This turns raw trap data into immediate insights. Instead of poring over log files, you get real-time charts and graphs – one of the killer T-Pot features for analysts.
- Visualization & Analysis Tools: Beyond Kibana, T-Pot bundles tools like CyberChef (for decoding captured data), Elasticvue (Elasticsearch GUI), SpiderFoot (OSINT tool), and a GeoIP attack map. These make it easy to pivot from an alert to deeper investigation. For example, you can click on an IP in Kibana, jump to SpiderFoot to see that attacker’s footprint, or use CyberChef to quickly inspect a grabbed payload.
- Network Security Monitoring (NSM): T-Pot doesn’t just log hits on honeypots; it also runs Suricata on the sensor interface. This IDS engine watches all traffic (including attacks passing through the host) and logs it into the same Elastic Stack. In practice, this means you get deeper threat intelligence: Suricata events (malware signatures, suspicious patterns) are correlated with honeypot data. Analysts can search across both, getting a full picture of what attackers are doing.
- Community Threat Sharing: By default T-Pot ships data to Telekom’s Sicherheitstacho platform, anonymously sharing your catch with the community. This crowdsources part of the analysis, and you can opt out if desired. For lone professionals, this means your honeypot isn’t just local – it contributes to a collective threat intelligence effort, helping spot broad attack campaigns.
Benefits and Threat Intelligence
- Broad Attack Coverage: Because T-Pot simultaneously emulates so many services, it records a diverse range of attacks. You can see brute-force SSH attempts, automated web exploits, IoT bot probes, industrial SCADA scans and even attacks targeting printers or mail servers. This variety means you’re more likely to catch the latest attacker tactics than with a single-purpose honeypot.
- Rich Threat Data: Every honeypot interaction is logged in detail. That includes source IP addresses (and derived country/ISP), login credentials tried, malware samples dropped, and commands executed by intruders. For example, you can quickly pull a list of all unique passwords tried against your honeypots, or see which country most attacks originate from. This raw data is invaluable for threat hunting and building intelligence reports.
- Realistic Deception: T-Pot’s traps are realistic. Honeypots like Conpot (industrial control), WordPot (vulnerable WordPress), or CiscoASA emulators are deliberately chosen to mimic real-world targets. Attackers think they’ve hit a juicy target, so they behave as they normally would – giving you genuine attacker behavior to study. This deception technology aspect lures adversaries into a controlled lab environment, protecting your real assets.
- Easy Analysis: With built-in dashboards and maps, T-Pot saves hours of work. Instead of manually parsing logs, you get an immediate, visual dashboard overview of threats. For instance, one dashboard might show “Cowrie (SSH) has 1000 login attempts, mostly from Russia,” while another shows “Glastopf (web) saw 200 exploit payloads, mainly targeting PHP.” These at-a-glance insights let you spot emerging threats (a spike in one service, a new malware signature) without crafting reports from scratch.
- Continuous Learning: Because it runs 24/7, T-Pot collects historical data. Security pros can mine that archive for trends: Which days see the most attacks? Are certain IPs repeat offenders? T-Pot even integrates with tools like SpiderFoot for enrichment. All of this supports proactive defense: you learn how attackers probe your (fake) network, then tune firewalls and IDS rules accordingly.
T-Pot vs Traditional Honeypots
| Aspect | Standalone Honeypot | T-Pot Platform |
|---|---|---|
| Honeypot Variety | One or a few (e.g. just an SSH/Telnet trap) | 20+ integrated honeypot services (SSH, web, ICS, mail, etc.) |
| Deployment | Manual install per honeypot, point tools | One-click Docker install and auto-configuration via script |
| Data Analysis | Raw logs or custom scripts; no UI | Built-in ELK stack with Kibana dashboards and live maps |
| Scalability | Limited to one server | “Hive” + multiple “Sensor” nodes for distributed deployment |
| Threat Intelligence | Local log files only | Optional sharing to community (Sicherheitstacho) and rich logs for intel |
| Maintenance | Update honeypot tools individually | Central updates; containers auto-restart with Autoheal |
This comparison shows why T-Pot is so popular: it turns the chore of managing many honeypots into a single, automated honeypot platform. You get all the benefits of traditional traps, plus centralized monitoring and sharing. As a result, T-Pot not only catches individual attacks but provides comprehensive threat intelligence and a strong deception capability in one package.
In summary, T-Pot’s friendly dashboard and powerful back-end make it a go-to solution for professionals. It frees you to focus on analyzing threats instead of configuring traps. Whether you’re a security researcher or a SOC analyst, T-Pot’s features – from Docker ease-of-use to ELK visualizations and community sharing – deliver a rich stream of threat intelligence for proactive defense.
Prerequisites for Deploying T-Pot
Figure: The T-Pot multi-honeypot platform logo. T-Pot bundles dozens of honeypot services into one platform (it “supports 20+ honeypots”), so it can be resource-hungry. The official docs say you’ll need “at least 8–16 GB RAM, 128 GB free disk space” and a working internet connection. In practice, aim higher: e.g. a quad‑core CPU and 16+ GB RAM for a smooth virtual honeypot setup. Below is a quick summary of the core system requirements:
| Component | Minimum | Recommended | Notes (T-Pot specifics) |
|---|---|---|---|
| CPU | 2 cores (vCPUs) | 4+ cores | More cores = better performance. Aim for modern multi‑core CPU. |
| RAM | 8 GB | 16+ GB | Each honeypot container uses RAM. (T-Pot sensor needs ~8 GB, full hive ~16 GB.) |
| Storage | 128 GB SSD | 256+ GB SSD | SSD speeds up logging/indexing. Logs persist ~30 days (use extra space if traffic is heavy). |
| Network | 1× Ethernet NIC | ≥1× Ethernet NIC | Wired IPv4 connection; ensure outbound internet. You can dedicate a second NIC to management. |
| Internet | Broadband (IPv4) | — | Unfiltered Internet access required for updates and community feeds. |
| OS | Linux x86_64 | Latest Ubuntu/Debian | Use a minimal install (no desktop GUI, just SSH). Supported: Debian, Ubuntu, Fedora, etc. |
- Operating System: Install a 64‑bit Linux OS (Debian, Ubuntu, Fedora, etc.) with only essential services (SSH enabled). A netinstall/minimal image is ideal (no extra GUI or apps), to avoid port/service conflicts.
- Networking: T-Pot requires a working IPv4 address (DHCP or static) and open outbound internet. If you have multiple NICs, you could use one for management and one for honeypot traffic (e.g. honeypots on a “dirty” network, management on a safe LAN).
Bare Metal Setup
- Hardware: Any modern 64‑bit PC or server works. Aim to meet or exceed the specs above. SSD storage and gigabit Ethernet are highly recommended. Intel/AMD CPUs with virtualization (VT‑x/AMD‑V) are preferred. If you build dedicated hardware, check that your NIC and chipset are Linux-compatible (the docs advise testing the target distro on your hardware).
- Minimal Install: Load only the OS and SSH (no firewall/proxy). A static or DHCP IPv4 address is needed. Ensure the system can reach the internet (port 80/443) for updates.
- Tweaks: Disable or remove services that use common ports (HTTP, DNS, etc.) to avoid conflicts. BIOS virtualization features aren’t strictly required on bare metal (T-Pot uses Docker), but enabling them never hurts for future VM needs.
Virtual Machine Setup (VirtualBox, VMware, etc.)
- Hypervisors: T-Pot runs fine on most hypervisors. The developers tested it on VirtualBox, VMWare (Fusion/Workstation), KVM, and UTM. Even Apple M1/M2 (ARM64) can work via UTM, though you may need to install in console mode.
- Resources: Assign at least 2 vCPUs and 8 GB RAM to the VM, but 4+ cores and 16+ GB is ideal. Use a paravirtualized or bridged network adapter so the VM has its own IP.
- Network Settings: Use bridged networking so the VM is on the same LAN as your host. Enable promiscuous mode on the virtual NIC so traffic monitoring tools (like Suricata or p0f) can see all packets. If your host is on Wi-Fi and you’re using VirtualBox, select the “Intel PRO/1000 MT Server” NIC model for compatibility.
- Install: Mount a supported Linux ISO (Ubuntu/Debian) and follow the T-Pot install instructions. Avoid installing guest additions or extra software that might interfere with networking.
Cloud Deployment
- Supported Clouds: T-Pot is known to work on Telekom’s Open Telekom Cloud (OTC) and many users report success on AWS, Azure, GCP, etc.. (T-Pot 24.04+ removed many old cloud-specific conflicts.) Always check your provider’s docs and the T-Pot GitHub issues for any cloud quirks.
- Instance Size: Pick a large Linux VM (>=4 vCPU, 16+ GB RAM, 100+ GB disk). For example, AWS “general purpose” instances in the 16GB range are often a good start.
- Network & Firewall: Ensure the VM has a public IPv4 or proper port mapping. Open outbound HTTP/HTTPS for updates. You’ll also need to open/forward the incoming ports that the honeypots use (see the T-Pot docs). Default VM firewalls (security groups) may block these, so adjust accordingly.
- Storage: If your cloud disk is small, attach extra SSD/EBS volume for logs. T-Pot will store logs under
~/tpotce/data, so give it at least 100 GB.
By meeting these T-Pot system requirements and honeypot hardware prerequisites up front, your deployment should go smoothly. In summary: ensure a solid 64‑bit Linux host (bare-metal, VM or cloud) with enough CPU cores, RAM, and SSD space – plus a reliable Ethernet connection. Once the prerequisites are set, you’ll be ready to install and start capturing attacks with T-Pot!
Installation Walkthrough
Setting up T-Pot on Ubuntu Server is straightforward if you follow the official GitHub method. In this T-Pot installation guide, we’ll walk through each step—from a clean Ubuntu Server install to running the T-Pot installer script—so you can quickly deploy a cybersecurity honeypot. This honeypot setup tutorial assumes Ubuntu Server (24.04 LTS or later, 64-bit) with a minimal install (no desktop GUI). You should have at least 8–16 GB of RAM and about 128 GB of disk (256 GB or more is ideal for a full “Hive” deployment). Also ensure the machine has an active internet connection (non-proxied) so Docker images and updates can be fetched.
| Component | Recommended |
|---|---|
| OS | Ubuntu 24.04 LTS Live Server (minimal install) |
| RAM | 8–16+ GB (Hive: ≥16 GB) |
| Storage | ≥128 GB SSD (Hive: ≥256 GB) |
| Network | IPv4 with direct internet access (DHCP or static) |
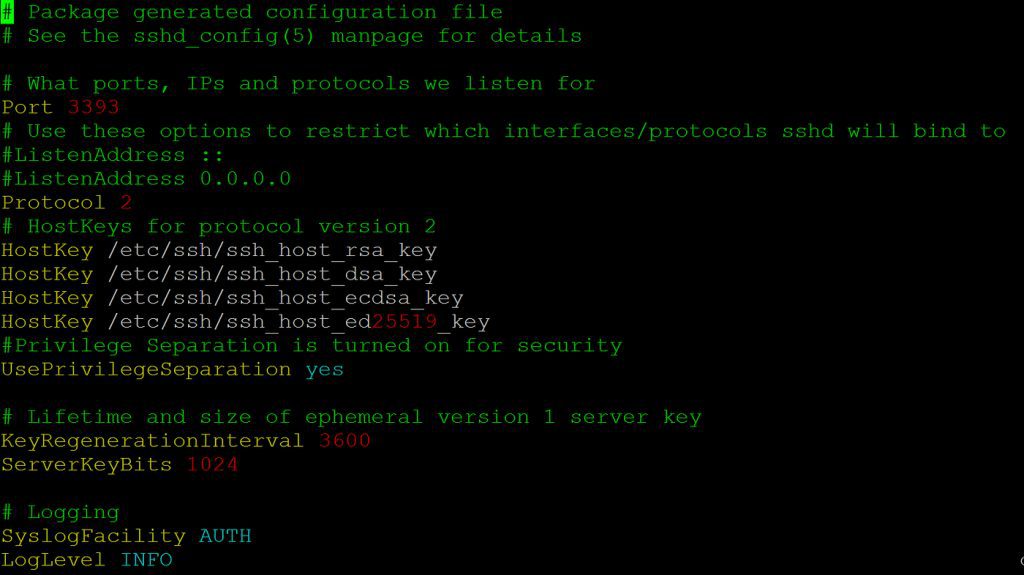
| Extras | No GUI; SSH enabled (T-Pot will move SSH to port 64295) |
Prepare Ubuntu Server
- Install Ubuntu Server. Download the Ubuntu 24.04 LTS Server netboot/live-server image and install with only core packages. Use the “minimum” or “netinstall” option, do not install any desktop environment (Gnome/KDE) since T-Pot uses many network ports. During setup, install and enable SSH so you can connect remotely.
- Update and install tools. After first boot, update packages and install Git (and optionally
curl):sudo apt update && sudo apt upgrade -y sudo apt install -y git curlThis ensures you can clone the T-Pot repository. No special Docker or Java installs are needed; the T-Pot installer will handle Docker for you. - Create a non-root user. Make sure you have a regular user with
sudoprivileges, and do not run the installer as root. The installer script must be run as a normal user (it will prompt for your password when needed).
Clone T-Pot Repository and Run Installer
With the server prepared, the next step is to grab the official T-Pot code and launch the setup script:
- Clone the repo:
git clone https://github.com/telekom-security/tpotce.gitThis fetches the latest T-Pot installer and configuration files. - Change into the directory:
cd tpotce - Run the installer:
./install.sh(If prompted, you may need to make it executable:chmod +x install.sh.) The installer will perform automated configuration tasks based on your Linux distro. For example, on Ubuntu it will add Docker’s repo, install Docker/Compose, change SSH to port 64295, disable DNS stub listeners, adjust the firewall to accept public traffic, and add helpful aliases (see installer output).
During installation you’ll see interactive prompts (in green output). Typical steps include:
- Choose the installation type: You can pick Hive (Standard), Sensor, or Mobile modes. For a single-host setup, choose Hive by typing
hwhen prompted. (Hive mode installs everything on one machine; Sensor mode omits Kibana/Elastic to act as a lightweight honeypot node.) - Set a web UI user: The installer will ask you to create a username and password for the T-Pot web interface. This becomes the admin account for accessing dashboards (on port 64297).
- Review port conflicts: Before finalizing, the script will list any open ports it found. Ensure no essential service (like an existing web server) is blocking T-Pot’s ports. You can cancel if you see conflicts, stop those services, and run the installer again.
Once the automated steps finish, you will see a message like “Done. Please reboot and re-connect via SSH on tcp/64295.”. Finally, reboot the machine to apply all changes:
sudo reboot
First Login and Verification
After reboot, connect via SSH using the new port and your Linux user account:
ssh -l <username> -p 64295 <server_ip>
(The default password is what you set during Ubuntu install.) On first login, you can run dps.sh or docker ps -a to verify all T-Pot containers are running. You should also see SSH listening on 64295 (instead of 22) and the management web UI on port 64297. For example:
sudo netstat -tulpen | grep 64295
If login fails, remember that T-Pot moves SSH to port 64295. If your SSH client defaults to 22, you’ll need to specify the port as above.
The T-Pot landing page and dashboards are then available at https://<server_ip>:64297/. Use the web username/password you created to log in. (Accept the self-signed certificate warning in your browser.) At this point, your cybersecurity honeypot deployment is live – honeypot services will automatically begin capturing attack traffic.
VirtualBox/VMware Tips
If you’re running T-Pot in a virtual machine (VirtualBox, VMware, etc.), a few extra settings will help it work smoothly:
- Networking: Use a bridged network adapter (or similar) so T-Pot sees external traffic. In VirtualBox, set the NIC to “Bridged Adapter” and enable Promiscuous Mode. This is required for packet sniffing tools (like p0f, Fatt, Suricata) to capture traffic.
- Adapter type: If using Wi-Fi or certain chipset, VirtualBox’s default NIC may not work. Choose the “MT Server” model for wireless cards to ensure compatibility.
- Resources: Allocate enough RAM and disk in the VM per the requirements above. For example, give a Hive VM 16 GB RAM and tens of GB storage.
- Headless setup: Since T-Pot has no GUI, you can run the VM in headless mode or with minimal console. Just ensure installation has the internet connected throughout.
With these settings, the installer inside the VM will proceed as on bare metal. After setup, treat the VM like any T-Pot sensor—forward the relevant ports from your virtual network to it, and you’ll start seeing honeypot alerts.
Troubleshooting Tips
Here are some common issues and fixes during installation:
| Issue | Solution/Tips |
|---|---|
| SSH login fails | T-Pot uses port 64295 for SSH. Use ssh -p 64295 or adjust your client. (Do NOT try port 22). |
| Port conflicts | Stop T-Pot service (sudo systemctl stop tpot) and run sudo netstat -tulpn or ss -tulpn to find conflicts. Disable or change any service using T-Pot’s ports, then retry. |
| Elastic/Kibana crash | Ensure you have ≥8 GB RAM (more for Hive). Low memory/storage causes Logstash/ES to fail. Add RAM or enable swap. |
| No traffic seen | If running in a VM, verify bridged mode + promiscuous as above. Also check firewalls: allow incoming to honeypot ports and make sure upstream firewall isn’t filtering. |
| Docker command errors | The installer adds your user to the docker group. If you still need sudo for Docker, log out/in or reboot. |
| Fail2Ban lockout | Repeated wrong logins may get your IP banned. Check sudo fail2ban-client status and unban if needed. |
If you do encounter installation errors, review the T-Pot logs and consult the official documentation. The key is usually ensuring no GUI or extraneous services are installed (clean Ubuntu), having internet access, and checking that essential ports (especially 64295/64297) are free. With this guide, your Ubuntu-based honeypot should be up and running without a hitch!
Exploring T-Pot Honeypots
T-Pot is an open-source, all-in-one honeypot platform (based on Debian) that bundles dozens of honeypot daemons into a single system. In practice this means T-Pot provides a “honeypot as a service” ready to run: it deploys many Dockerized traps at once, covering multiple protocol and application layers. A standard T-Pot installation includes honeypots such as Cowrie (SSH/Telnet), Dionaea (malware trap), Glastopf (web), Conpot (ICS/SCADA), plus many others (e.g. RDP, mail, mobile, Elasticsearch, etc.). In other words, T-Pot gives you types of honeypots in cybersecurity ranging from network service emulators to application- and industrial-control traps, all in one place.
Cowrie SSH/Telnet Honeypot
Cowrie is a medium/ high-interaction SSH and Telnet honeypot that emulates a Linux shell. It simulates an SSH/Telnet server and fake filesystem to lure attackers. Cowrie is famous for capturing brute-force login attempts and the commands attackers execute. For example:
- Emulated service: SSH and Telnet (interactive UNIX shell). Cowrie can run as an SSH/Telnet proxy or as a full shell emulator.
- Attracts: automated botnets and attackers scanning for SSH/Telnet logins. It typically sees credential-guessing and brute-force attacks on port 22/23.
- Use cases/benefits: It logs attacker behavior and file operations. Cowrie records all login attempts, the shell commands entered, and any files downloaded/uploaded via SFTP or SCP. This gives security teams clear insights into attacker tactics (malicious commands, malware binaries, etc.) while the real systems stay protected.
Dionaea Malware Honeypot
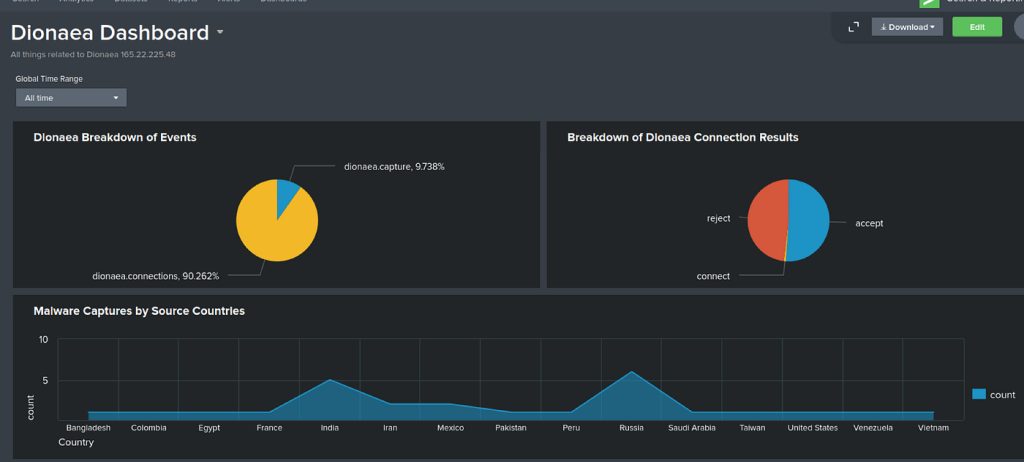
Dionaea is a low-interaction malware collection honeypot designed to trap and capture malware. It emulates many vulnerable services to snare automated exploits. Key points:
- Emulated services: Multiple protocols such as SMB (file share), HTTP, FTP, TFTP, MSSQL, SIP/VoIP and more. Dionaea “speaks” many server protocols with fake responses.
- Attracts: network worms and malware scanners that look for common service vulnerabilities. Attackers or bots exploiting, e.g., SMB or TFTP, will hit Dionaea instead of a real target.
- Use cases/benefits: Dionaea collects malware binaries by allowing attackers to “exploit” its fake services. Captured samples can be analyzed offline. It’s widely used for malware research and threat intelligence, revealing which vulnerabilities attackers are exploiting in the wild.
Glastopf Web Honeypot
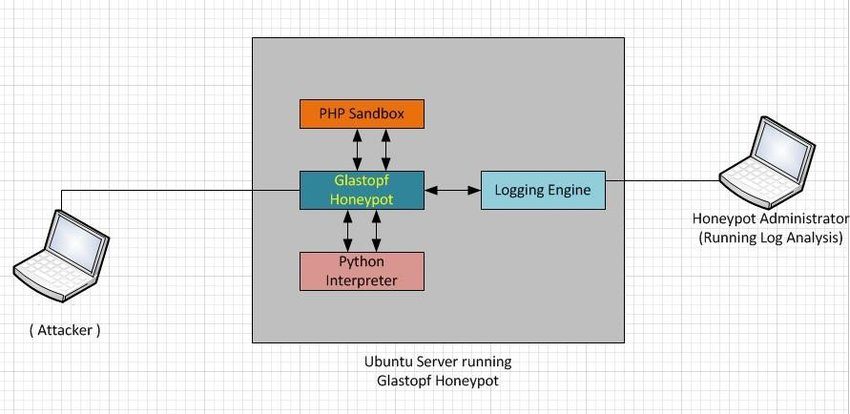
Glastopf is a web application honeypot written in Python that emulates thousands of web vulnerabilities. Instead of a single fake site, Glastopf dynamically creates realistic responses to attract web attackers. Highlights include:
- Emulated service: An HTTP server that simulates common web app flaws (e.g. remote file inclusion, local file inclusion, HTML injection, SQL injection, etc.). It can mirror how a site should behave under attack.
- Attracts: attackers and bots scanning for web vulnerabilities via search engines (“dorks”) or random probes. Glastopf even uses trending keywords (“Google dorks”) to make itself appear as a juicy target.
- Use cases/benefits: It logs web-based attacks and payloads sent by attackers (malicious requests, exploit attempts, attack patterns). This helps defenders see what web exploits are being tried. Because it automatically adapts to new attack patterns, Glastopf remains engaging to attackers, generating long-term datasets of web intrusion attempts.
Conpot ICS/SCADA Honeypot
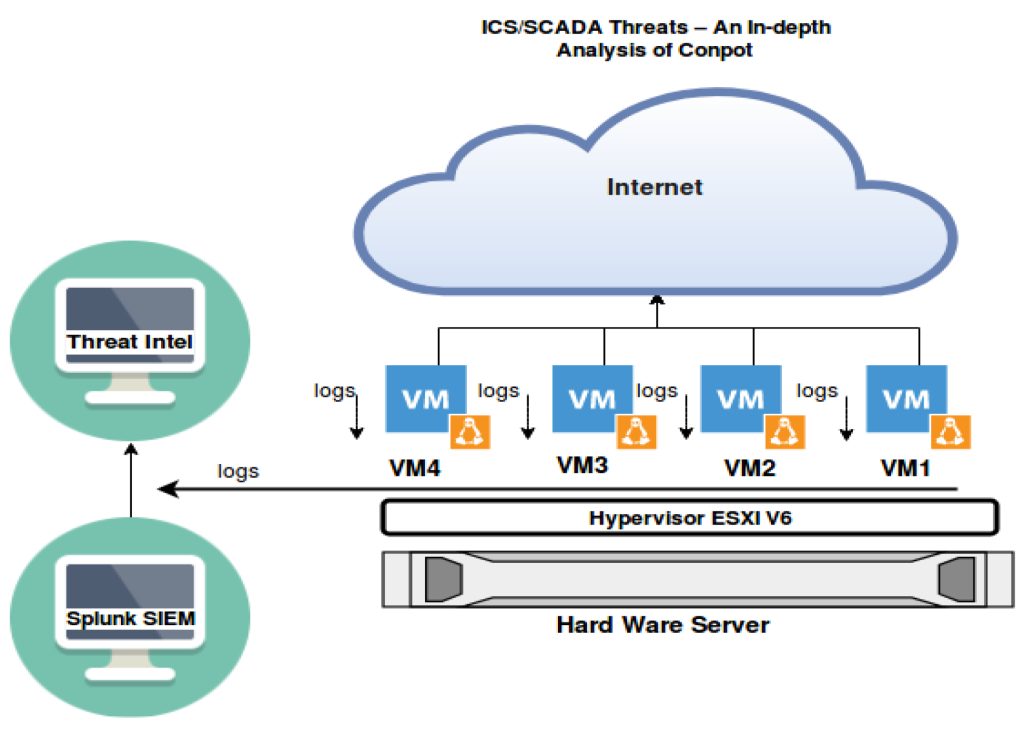
Conpot is an industrial control system (ICS) / SCADA honeypot, aiming to lure attackers targeting OT (operational technology) networks. It mimics common industrial devices and protocols to collect adversary tactics. Details:
- Emulated services: Conpot offers fake SCADA/ICS protocols and devices out of the box. In a default setup it might run FTP (port 21), Siemens S7 (102), Modbus (502), TFTP (69), BACnet (47808) and HTTP services to look like a PLC or control hub.
- Attracts: attackers and scanners searching for ICS devices (e.g. via Shodan or ICS vulnerability scanners). Specialized ICS malware or threat actors probing manufacturing networks are drawn to Conpot as if it were a real PLC.
- Use cases/benefits: Conpot captures ICS-targeted attacks, logging any industrial protocol commands or scans. This yields intelligence on threats to critical infrastructure (e.g. attempts to read/write PLC data). By observing attacker behavior in an emulated control system, defenders can learn and improve real-world industrial network security.
Other T-Pot Honeypots
T-Pot includes many other specialized honeypots. Examples include:
- ElasticPot (Elasticsearch honeypot): Simulates a vulnerable Elasticsearch server. It lures attackers who scan for open ES databases, recording their queries or exploits.
- ADBHoney (Android ADB honeypot): Emulates an Android Debug Bridge service on TCP port 5555. It catches malware or attackers trying to connect to unsecured Android devices.
- Mailoney (SMTP/IMAP honeypot): Fakes an email server to log spammers and attackers targeting mail infrastructure. For example, it can record SMTP login attempts or spam campaigns (no external source needed here).
- RDpy (RDP honeypot): Emulates Microsoft Remote Desktop login. It captures RDP brute-force logins and malicious login attempts (e.g. bots scanning for BlueKeep/SMB flaws).
- Honeytrap/Heralding, Snare, Glutton, etc.: Generic honeypots or decoy services that respond to network probes on multiple ports. They further broaden T-Pot’s coverage of attack surfaces (SSH, HTTP tokens, general TCP/UDP, etc.).
By combining all these, T-Pot offers a rich sandbox for honeypot use cases – from SSH credential logging to web exploit collection to industrial threat monitoring.
| Honeypot | Emulated Service / Focus | Typical Attackers / Traffic | Use Cases / Notes |
|---|---|---|---|
| Cowrie | SSH/Telnet (Linux shell) | SSH/Telnet brute-force bots and scanners | Captures login attempts, commands and files (SCP/SFTP uploads) |
| Dionaea | Multi-protocol (SMB, HTTP, FTP, TFTP, MSSQL, SIP, etc.) | Malware-spreading worms and exploit bots | Collects malware payloads by simulating vulnerable services |
| Glastopf | Web application (RFI, LFI, SQLi, PHP, etc.) | Web scanners and exploit bots using “dorks” | Logs web exploit attempts and payloads, adapts to new attack types |
| Conpot | ICS/SCADA (Modbus, S7, FTP, BACnet, etc.) | Attackers probing industrial control systems | Hones ICS-targeted attacks; gathers intel on SCADA intrusion methods |
| ElasticPot | Elasticsearch database | Attackers scanning for open ES clusters | Snares anyone trying to exploit Elasticsearch instances |
| ADBHoney | Android Debug Bridge (port 5555) | Malware or attackers targeting Android ADB | Captures Android-targeted malware uploads/commands |
| (Others) | Mail (SMTP), RDP, etc. | Email spammers, RDP crackers, etc. | E.g. Mailoney catches SMTP/IMAP attacks, RDpy logs RDP login attempts |
Honeypot Use Cases
Honeypots like those in T-Pot have diverse use cases in cybersecurity. In general, honeypots are decoys that simulate vulnerable systems to lure attackers and gather intelligence. Typical uses include:
- Threat intelligence & attack analysis: Honeypots reveal attacker tactics in real time. For example, an SSH honeypot (Cowrie) logs malware commands and brute-force patterns. By analyzing this data, defenders learn new attack methods.
- Malware collection: Malware-focused honeypots (Dionaea, ADBHoney) trap actual malicious binaries and exploit code. Captured malware can be reverse-engineered in a safe environment. Researchers gain insight into active threats (even zero-day exploits) from the collected samples.
- ICS/OT security: Specialized honeypots (Conpot) emulate industrial devices, so defenders can monitor attacks on critical infrastructure without risking real PLCs. As one study notes, such honeypots “replicate various protocols and devices, enabling a deeper understanding of attacker strategies” on industrial networks.
- Credential capture and fraud detection: Honeypots can catch attackers testing stolen credentials or performing fraud. For example, a fake web login or mail server will log stolen password use without compromising actual users.
- Training and validation: Security teams use honeypots to generate realistic attack logs for testing detection tools or for training analysts, since “honeypot traffic is limited to nefarious actors” making analysis straightforward.
- Deception and diversion: Honeypots can distract attackers away from real assets. By engaging an attacker in a controlled environment, they reduce risk to the production network.
In summary, each honeypot in T-Pot serves a role (SSH honeypot, web honeypot, malware trap, etc.) that corresponds to common honeypot use cases – from collecting malware and brute-force attempts to gaining ICS threat intelligence. As a result, T-Pot operators can observe a wide range of malicious activity in one consolidated platform, greatly enhancing visibility into attacker behavior.
Managing and Monitoring Attacks
When it comes to T-Pot attack monitoring, the built-in Kibana honeypot dashboards are your best friends. T-Pot funnels all honeypot events into Elasticsearch/Kibana, giving you nice visual charts and maps of everything happening on your decoys. For example, the main T-Pot dashboard shows total attacks by honeypot, a time histogram, a geo-map of source IPs, and even tag clouds of common usernames/passwords. You can filter by honeypot or time range to zoom in on specific events, and the “Attack Map” dashboard plots live attack origins on a world map for a quick country-level view. In short, these honeypot dashboards turn raw logs (IP addresses, ports, payloads, credentials, etc.) into actionable threat intelligence visualizations with just a few clicks.
Behind the scenes, T-Pot also supports powerful command-line tools for real-time monitoring. The dps/dpsw scripts (short for “Docker PS”) list all running honeypot containers and their CPU/memory use. You can use standard Docker commands (docker ps, docker logs) or the Portainer web UI (if enabled) to restart honeypots, watch their logs, and check container health. Suricata is running too, logging network alerts (e.g. exploit attempts, malware downloads) into ELK. You can inspect Suricata’s JSON logs on the command line or in Kibana for details on traffic anomalies. In practice, you might ssh into the T-Pot host and use tools like netstat, top, or grc docker ps to complement what you see in the dashboards. These CLI views let you quickly verify that all sensors are up and spot any resource spikes.
Key data collected: T-Pot honeypots record a wide range of attacker activity. Logs include attacker IP addresses (with GeoIP lookups and reputation tags), target ports/services probed, and any malicious payloads or files the attacker tries to upload/download. Interactive honeypots like Cowrie capture the exact commands and credentials an attacker types, while credential-trapping honeypots (e.g. Heralding) record any user/password pairs used. Malware honeypots (like Dionaea) save any downloaded exploit binaries. All of these data (along with Suricata alerts and tagged CVEs) end up in Elasticsearch. You can then analyze honeypot logs by filtering in Kibana – for example, searching for repeated login attempts from one IP, or graphing how often a certain payload string appears. T-Pot even pre-tags events with IP reputation and CVE IDs, so suspicious entries stand out automatically.
To extract and interpret this data for threat intelligence, start with the dashboards and then drill down. For instance, look at the “Top 10 Attacker IPs” widget – clicking an IP can even open an external lookup (like Cisco Talos) for more context. You can edit any Kibana visualization to add extra buckets (e.g. geoip.country, asn, or ip.rep fields) and display hundreds of IPs. Combine that with Elastic maps to spot geographic trends or concentric-bar charts to see which services (SSH, HTTP, etc.) are most targeted. The built-in Attack Map dashboard gives a real-time global view of where attacks are coming from. For finer analysis, you can download logs (or use the ELK data export) and grep them, or feed them into tools like SpiderFoot (integrated in T-Pot) to automatically gather OSINT on any IPs or domains. In essence, you use Kibana’s visualizations to highlight anomalies (big spikes of traffic, unknown usernames, rare CVEs) and then manually or automatically enrich that with external threat intel. This combination of dashboards and hands-on log work makes it much easier to identify, visualize, and respond to attack patterns.
- Data Collected: IP addresses (with GeoIP), targeted ports/services, login credentials/commands, malware payloads, and NSM alerts (CVE tags, etc.).
- Log Extraction: Use Kibana filters and searches to group events by IP, port, country, or payload string. You can also download raw logs and use
grep,jq, or similar tools to parse them on the command line. - Analysis Tips: Focus on hotspots – e.g. the busiest source IPs, sudden bursts of scans, or new exploit strings. Visual aids like time-series charts or geo maps quickly reveal patterns. Track repeat offenders by IP reputation or ASN, and correlate events across honeypots to spot coordinated campaigns.
Best practices: Keep an eye on log retention and storage. By default, T-Pot retains honeypot logs and tooling data for 30 days and Kibana/Elasticsearch data for 90 days. Adjust these limits in logrotate.conf and the Curator actions file if you need longer history. Make sure you have enough disk space (T-Pot recommends tens of GBs) because high activity can fill logs quickly. It’s wise to periodically archive old logs or send them to an external SIEM/HPFeeds broker before they get rotated away. In general, centralize and back up your data: continuous logging and preservation allow you to slice time ranges and run long-term trend analysis.
Visualizing attack patterns: Exploit Kibana’s full suite of visualization types. Histogram and line charts (time series) show attack frequency over hours or days. Bar charts can rank the most-targeted ports or top countries. Word clouds or pie charts can highlight common usernames/passwords attempted. The built-in geo map helps you see which regions are most active. For example, creating a bucket on geoip.country_name will color-code attacks by country. Use thresholds or anomaly detectors on these visuals to alert on sudden changes (like a DDoS spike). Remember, the Attack Map in T-Pot is more for a real-time glance – your Kibana dashboards are where you get the deep dive and can correlate multiple honeypots at once. All these charts form your threat intelligence visualization, turning tedious log entries into intuitive patterns that you can spot at a glance.
Monitoring Tools & Capabilities: The table below summarizes key T-Pot monitoring tools you’ll rely on:
| Tool | Purpose/Capabilities |
|---|---|
| Kibana (Elastic) | Visualization hub for honeypot events. Provides pre-built dashboards (attacks over time, top IPs, user/pass clouds, geo maps, etc.). Great for filtering and drilling down into attack details. |
| Portainer | Web UI for Docker. Lets you view, start/stop/restart T-Pot containers and monitor their resource usage. Handy for troubleshooting or scaling your honeypot setup. |
| Suricata (IDS) | Network IDS that logs all traffic to/from honeypots. Captures anomalies, exploit signatures, file/malware info, and forwards JSON alerts to ELK. Use its alerts to spot network-level attack patterns. |
| Docker CLI (dps) | Command-line management of containers. T-Pot’s dps/dpsw (alias for docker ps -a) shows running honeypot services with CPU/memory stats. Use docker logs or T-Pot’s tsec commands to tail individual sensor logs and troubleshoot. |
Each of these tools complements the others. By combining Kibana’s rich honeypot dashboards with quick CLI checks (dps, docker logs, grep, etc.), you can analyze honeypot logs efficiently and keep on top of your threat feeds. Over time, you’ll spot recurring IPs, new exploit trends, or credential lists flooding in. Visualizing those patterns and retaining logs long enough to see trends will make your T-Pot deployment a valuable source of threat intelligence.
Integrating T-Pot with Your Security Stack
Integrating T-Pot into your existing security stack allows you to centralize and enrich honeypot data for real-time threat detection and historical analysis. You can forward T-Pot logs to industry-standard SIEMs like Splunk via HTTP Event Collector (HEC) or a Splunk Technical Add-on for automated parsing, push honeypot events into Elastic SIEM through NDJSON exports or Logstash, or ship logs to Microsoft Sentinel using Azure Monitor Agent (AMA) and Data Collection Rules (DCR) . For lighter-weight setups, you can use rsyslog to stream JSON logs to any syslog-compatible tool, or even feed specific honeypot streams into Graylog using a custom GELF-capable agent like Graypot. This consolidated approach boosts your threat intelligence capabilities and ensures actionable insights from every honeypot interaction.
Why Integrate T-Pot into Your Security Stack?
- Unified Visibility: Centralize all honeypot data—login attempts, malware captures, exploit payloads—into a single SIEM dashboard to spot patterns across protocols and services (GitHub).
- Automated Parsing & Tagging: Use vendor-provided or community-maintained add-ons (e.g., Epicism’s TPOT-Honeypot-TA for Splunk) to automatically parse JSON logs and enrich them with fields like honeypot name and event type (GitHub).
- Real-Time Alerts: Trigger alerts for unusual activity (e.g. successful logins in Cowrie, new malware in Dionaea) directly from your SIEM, reducing the time from detection to response (GitHub).
- Long-Term Trend Analysis: Retain and correlate months of honeypot logs for baseline adjustments, attacker profiling, and post-incident forensics (GitHub).
Log Forwarding Methods
1. Splunk via HTTP Event Collector (HEC)
Forward T-Pot’s Logstash output directly to Splunk HEC by creating an HTTP token in Splunk and configuring T-Pot’s Logstash pipeline to use that endpoint (GitHub).
2. Logstash to Any SIEM
Leverage T-Pot’s built-in ELK stack: customize logstash.conf to forward events to external SIEMs over TCP/UDP, Kafka, or custom outputs. This approach works with Elastic SIEM, QRadar, and others (GitHub).
3. Rsyslog Streaming
Configure rsyslog on the T-Pot Hive to watch /home/tpotuser/tpotce/data/*/log/*.json and forward them to a remote syslog server or SIEM input on port 514 or a custom port (GitHub).
4. NDJSON Export for Elastic SIEM
Use Kibana’s “Export all” feature to download saved objects and dashboards as an NDJSON bundle. Import this into another ELK deployment or Elastic SIEM to replicate your T-Pot visuals and alerts (GitHub).
5. Microsoft Sentinel via AMA & DCR
Install the Azure Monitor Agent on your T-Pot host, configure Data Collection Rules (DCR) to collect JSON logs from honeypot directories, and send them to an Azure Log Analytics workspace with Sentinel enabled (Modern Security).
6. Graylog with Graypot or Beats
Although Filebeat isn’t supported by default in T-Pot (T-Pot relies on Logstash for ingestion) (GitHub), you can use Graypot—a lightweight SSH honeypot with native Graylog (GELF) output—or configure a TCP input in Graylog to receive JSON logs from T-Pot’s Docker containers (GitHub).
7. Manual Transfer (SCP/Compression)
For ad-hoc analysis or offline forensics, compress logs under ~/tpotce/data, SCP them to your workstation, and bulk import into Splunk or another SIEM for deeper analysis (Medium).
Threat Intelligence & Enrichment
- IP Reputation Lookups: Use SIEM integrations (e.g., Splunk Threat Intelligence Framework or Sentinel’s Threat Intelligence blade) to automatically enrich source IPs from T-Pot with ASN, geolocation, and blacklist status.
- CVE Correlation: T-Pot pre-tags some Suricata alerts with CVE IDs. Forward these tags to your SIEM to correlate against vulnerability management data.
- MISP Integration: Export relevant honeypot events (e.g., malicious binaries from Dionaea) as MISP events via API to share indicators of compromise (IOCs) with your threat intel community.
Integration Methods at a Glance
| Method | Tool/Protocol | Pros | Cons |
|---|---|---|---|
| HTTP Event Collector (HEC) | Splunk HEC | Native, token-based, secure, minimal configuration | Splunk-only |
| Logstash Forwarding | Logstash to SIEM (TCP/UDP) | Flexible outputs (Kafka, TCP, UDP), supports many SIEMs | Requires Logstash tuning |
| Rsyslog | Syslog | Universal, standard, low overhead | Less structured than JSON |
| NDJSON Export | Kibana Saved Objects | Exports dashboards & objects for Elastic SIEM clones | Manual steps, not real-time |
| Azure AMA & DCR | Azure Monitor Agent | Cloud-native, integrates with Sentinel alerts and workbooks | Requires Azure Arc on-prem onboarding |
| Graypot / Graylog TCP Input | GELF/TCP | Easy Graylog ingestion, custom SSH honeypot | Limited to SSH unless extended |
| Manual Transfer (SCP) | SCP + Bulk SIEM Import | Simple offline analysis | Not automated, manual effort |
By selecting the right integration method for your environment—whether it’s Splunk, Elastic, Sentinel, or Graylog—you can seamlessly fold T-Pot’s rich honeypot data into your existing security operations, supercharging your threat intelligence and improving response times to new threats.
Sources: Leading cybersecurity definitions and guides. Each citation corresponds to expert descriptions of honeypots, their benefits, and T-Pot’s platform details.